

Quality functions
A quality function measures how well the rescaled curves collapse; the fit minimizes it. All quality functions compare the curves only in the window where all system sizes overlap, intersected with dx, and use the error bars if they are given. Pass one as quality to ScalingProblem.
| quality function | compares | smooth in the parameters | recommended for |
|---|---|---|---|
MultipleSplines() (default) | interpolations of every size on a fixed grid | yes | almost everything |
MultipleSplines(interp=:cubic) | the same, with cubic splines | yes | noise-free data with peaks or several extrema |
Linear() | every point with the line between its neighbours | no | data on irregular grids; the default up to version 0.2 |
SingleSpline() | every point with one smoothing spline through all sizes | no | |
Houdayer() | every point with a local linear fit to the other sizes | no | comparison with the literature |
MultipleSplines
MultipleSplines interpolates the rescaled data of every size separately, evaluates the interpolations at N_steps (default 100) evenly spaced points of the window, normalizes them to the range
scaled_data(sp; splines=true) returns the interpolations that the quality function compares. For the synthetic data of the tutorial, they span only dx:
using ScalingCollapse
using Random

F(z) = 1 / (1 + exp(2z)) + 0.2
Ls = [16, 32, 64, 128]
xs = collect(range(0.3, 0.7; length=41))
rng = Xoshiro(42)
ys = Vector{Float64}[]
es = Vector{Float64}[]
for L in Ls
    y = L^(-0.3 / 1.2) .* F.((xs .- 0.5) .* L^(1 / 1.2))
    push!(es, 0.01 .* y)
    push!(ys, y .+ es[end] .* randn(rng, length(y)))
end
sf = ScalingFunction(:xy; p_names=["x_c", "nu", "beta"])
p_space = [0.4:0.01:0.6, 0.5:0.1:2.0, 0.0:0.05:0.6]
sp = ScalingProblem(xs, ys, es, Ls; sf, p_space, dx=[-3.0, 3.0])using CairoMakie
xs_s, ys_s, es_s, _, xvals, yvals, _ = scaled_data(sp; splines=true)
colors = cgrad(:Blues)[range(0.35, 1.0; length=length(Ls))]
fig = Figure(size=(620, 360))
ax = Axis(fig[1, 1]; xlabel=L"(x - x_c)\,L^{1/\nu}", ylabel=L"Y\,L^{\beta/\nu}")
for i in eachindex(Ls)
scatter!(ax, xs_s[i], ys_s[i]; color=colors[i], markersize=7, label="L = $(Ls[i])")
lines!(ax, xvals[i], yvals[i]; color=colors[i], linewidth=2)
end
vlines!(ax, sp.dx; color=:gray, linestyle=:dash)
xlims!(ax, -4, 4)
Legend(fig[1, 2], ax)
fig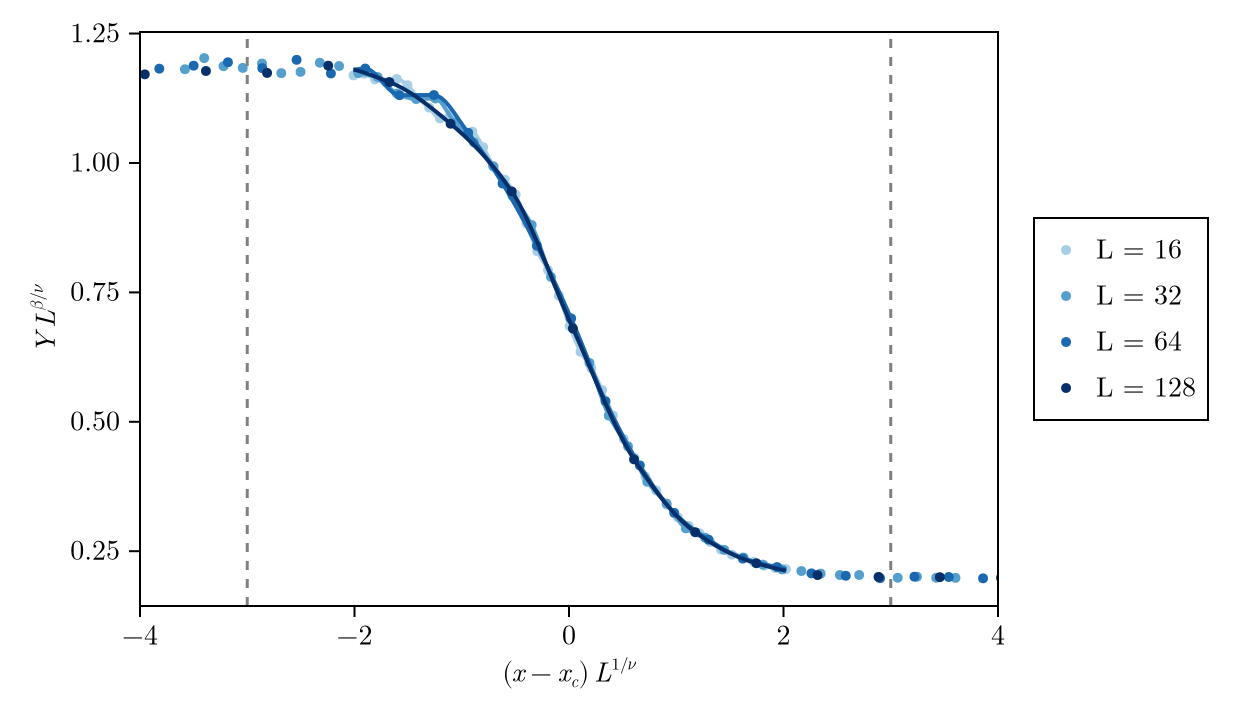
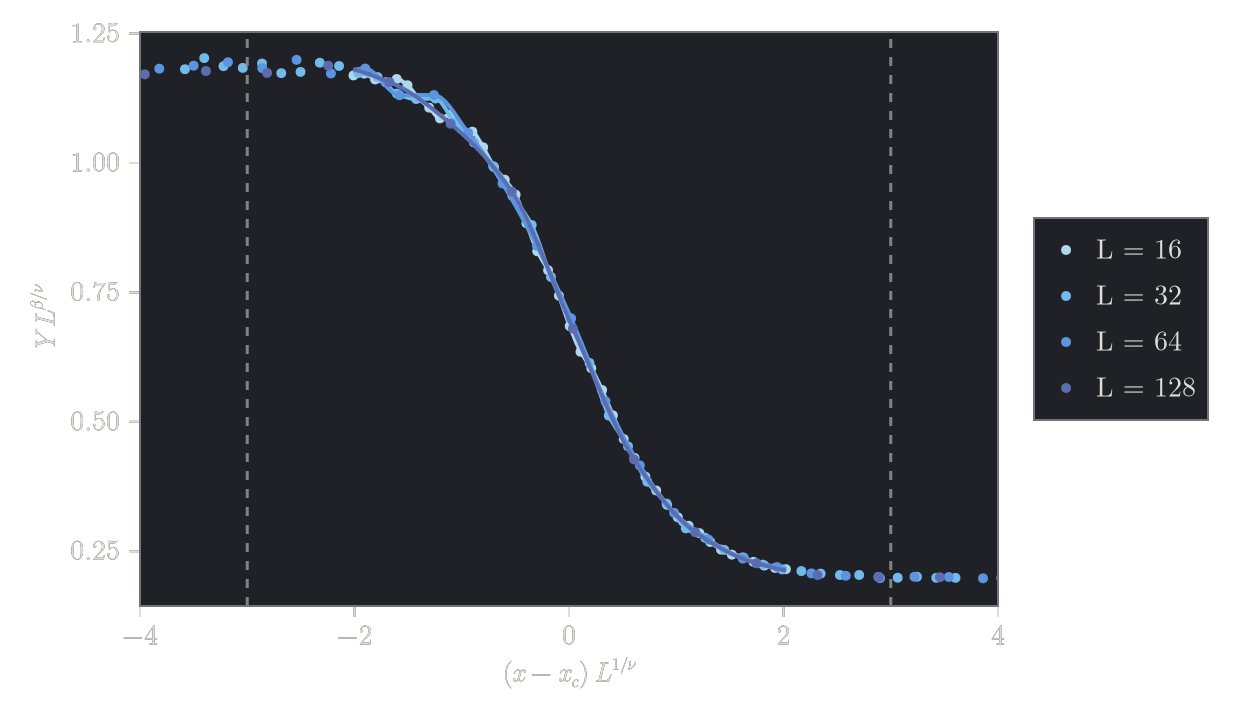
The default interpolation, interp=:pchip, is monotone between data points: it never overshoots, so closely spaced noisy points do not make it oscillate. The price is that a peak is cut off at its highest data point. interp=:cubic uses cubic interpolating splines instead, which represent peaks and several extrema better, but oscillate for noisy data on irregular grids. Use it for noise-free data, e.g. from exact calculations (see the mean-field example).
Linear, SingleSpline and Houdayer
These quality functions compare the data points themselves with a local estimate of the master curve built from the other points: Linear with the line between the two neighbouring points, Houdayer with a linear fit to the two bracketing points of every other size (Houdayer and Hartmann, 2004), and SingleSpline with a smoothing spline through all points.
All three change abruptly when rescaled points of different sizes pass each other, or enter or leave the window. On data measured on a uniform grid, the scaled grids of different sizes line up for special parameter values, which produces false local minima; the landscape example shows how strong this is. Houdayer is in addition biased towards large
On the data above, all quality functions give similar results:
qualities = ["MultipleSplines()" => MultipleSplines(),
    "MultipleSplines(interp=:cubic)" => MultipleSplines(interp=:cubic),
    "Linear()" => Linear(), "SingleSpline()" => SingleSpline(), "Houdayer()" => Houdayer()]
for (name, quality) in qualities
    s = ScalingProblem(xs, ys, es, Ls; sf, p_space, dx=[-3.0, 3.0], quality)
    println(rpad(name, 32), "x_c, nu, beta = ", round.(s.optimal_ps; digits=3),
        " ± ", round.(s.optimal_ps_error; sigdigits=2))
end
MultipleSplines() x_c, nu, beta = [0.499, 1.2, 0.297] ± [0.0011, 0.027, 0.012]
MultipleSplines(interp=:cubic) x_c, nu, beta = [0.499, 1.199, 0.296] ± [0.0011, 0.027, 0.013]
Linear() x_c, nu, beta = [0.499, 1.201, 0.299] ± [0.0013, 0.035, 0.017]
SingleSpline() x_c, nu, beta = [0.499, 1.2, 0.296] ± [0.0015, 0.037, 0.017]
Houdayer() x_c, nu, beta = [0.499, 1.221, 0.302] ± [0.0014, 0.034, 0.015]Writing a quality function
A quality function is a subtype of ScalingCollapse.QualityFunction with a call method (qf::MyQuality)(sp, ps; check_bounds=false) -> Float64. Use the existing ones in src/quality_functions/ as a template: they rescale every Data in sp.data with sp.sf.f(d, ps...), restrict the comparison to the overlap of all sizes and sp.dx, and return Inf for invalid parameters.