📉
One call, full fit
Pass your data and system sizes; a parameter scan and a Nelder–Mead refinement find the best collapse.
Find the critical point and exponents that collapse data from many system sizes onto one master curve, in pure Julia.


Near a continuous phase transition, an observable
Plotted against
using ScalingCollapse
using Random

# synthetic data with T_c = 2.0, ν = 1.0 and β = 0.125
F(z) = 1 / (1 + exp(2z))
Ts = collect(range(1.8, 2.2; length=41))
Ls = [16, 32, 64, 128]
ys = [L^(-0.125) .* F.((Ts .- 2.0) .* L) .+ 0.002 .* randn(Xoshiro(L), 41) for L in Ls]

sp = ScalingProblem(Ts, ys, Ls;
    sf=ScalingFunction(:xy; p_names=["T_c", "nu", "beta"]),
    p_space=[1.9:0.02:2.1, 0.5:0.1:1.5, 0.0:0.05:0.5],
)
ScalingProblem
Scaling function:
x -> (x - T_c) * L^(1/nu)
y -> y * L^(beta/nu)
Optimal parameters:
T_c = 2.0000170402418176 ± 0.00041621320597460946
nu = 1.0483092977275075 ± 0.0388852776812044
beta = 0.12956803324166713 ± 0.007245270920234711
Optimization interval dx:
-Inf < x < Inf
Searched parameter space:
T_c ∈ 1.9:0.02:2.1
nu ∈ 0.5:0.1:1.5
beta ∈ 0.0:0.05:0.5using CairoMakie
colors = cgrad(:Blues)[range(0.35, 1.0; length=length(Ls))]
fig = Figure(size=(760, 320))
ax1 = Axis(fig[1, 1]; xlabel=L"T", ylabel=L"Y", title="data")
ax2 = Axis(fig[1, 2]; xlabel=L"(T - T_c)\,L^{1/\nu}", ylabel=L"Y\,L^{\beta/\nu}", title="collapse")
xs_scaled, ys_scaled, _, _ = scaled_data(sp)
for i in eachindex(Ls)
scatterlines!(ax1, Ts, ys[i]; color=colors[i], markersize=6, label="L = $(Ls[i])")
scatter!(ax2, xs_scaled[i], ys_scaled[i]; color=colors[i], markersize=7)
end
xlims!(ax2, -6, 6)
Legend(fig[1, 3], ax1)
fig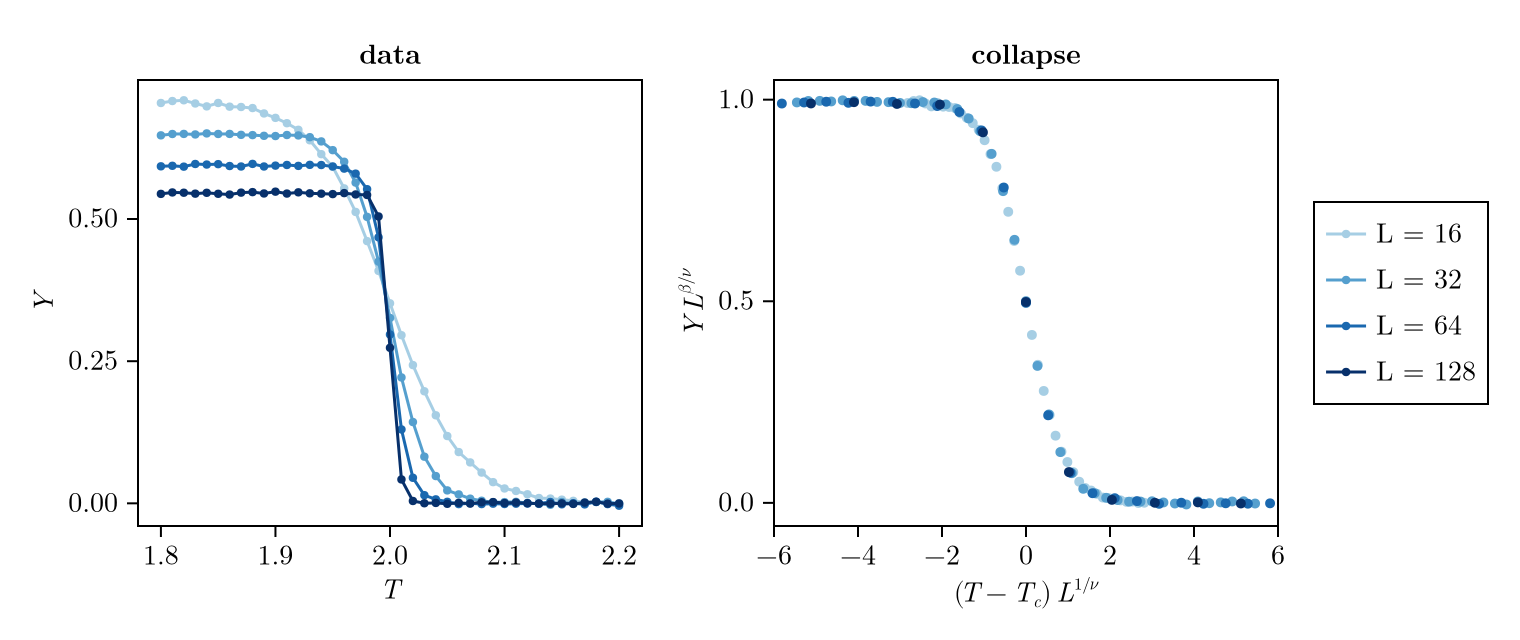
ScalingCollapse.jl is a registered Julia package (Julia 1.9 or later):
using Pkg
Pkg.add("ScalingCollapse")Getting Started walks through a first collapse step by step.
The Manual explains the input formats, the scaling functions, the fit, the error analysis and the quality functions.
The Examples apply the package to real data: the 2D Ising model, site percolation, a custom scaling form and more.
The API Reference documents every exported function.
Development status
ScalingCollapse.jl is still young. Expect breaking changes between minor versions, and please open an issue if you run into a problem.
If you use ScalingCollapse.jl in your research, please cite it via its Zenodo record, doi:10.5281/zenodo.10712427.