

Site percolation with error bars
Site percolation on the square lattice has a percolation threshold test/testdata/autoscale of the repository.
This example shows how to use error bars, how corrections to scaling show up, and how the error methods differ.
The data
Every file has three columns: occupation probability # are comments.
using ScalingCollapse
using DelimitedFiles

dir = joinpath(pkgdir(ScalingCollapse), "test", "testdata", "autoscale")
Ls = [8, 16, 32, 64, 128, 256, 512]
tables = [readdlm(joinpath(dir, "orderParam_L$L.dat"); comments=true) for L in Ls]
ps = [t[:, 1] for t in tables]   # occupation probability
P = [t[:, 2] for t in tables]    # order parameter
Pe = [t[:, 3] for t in tables]   # its error
length.(ps)
7-element Vector{Int64}:
31
33
33
44
43
44
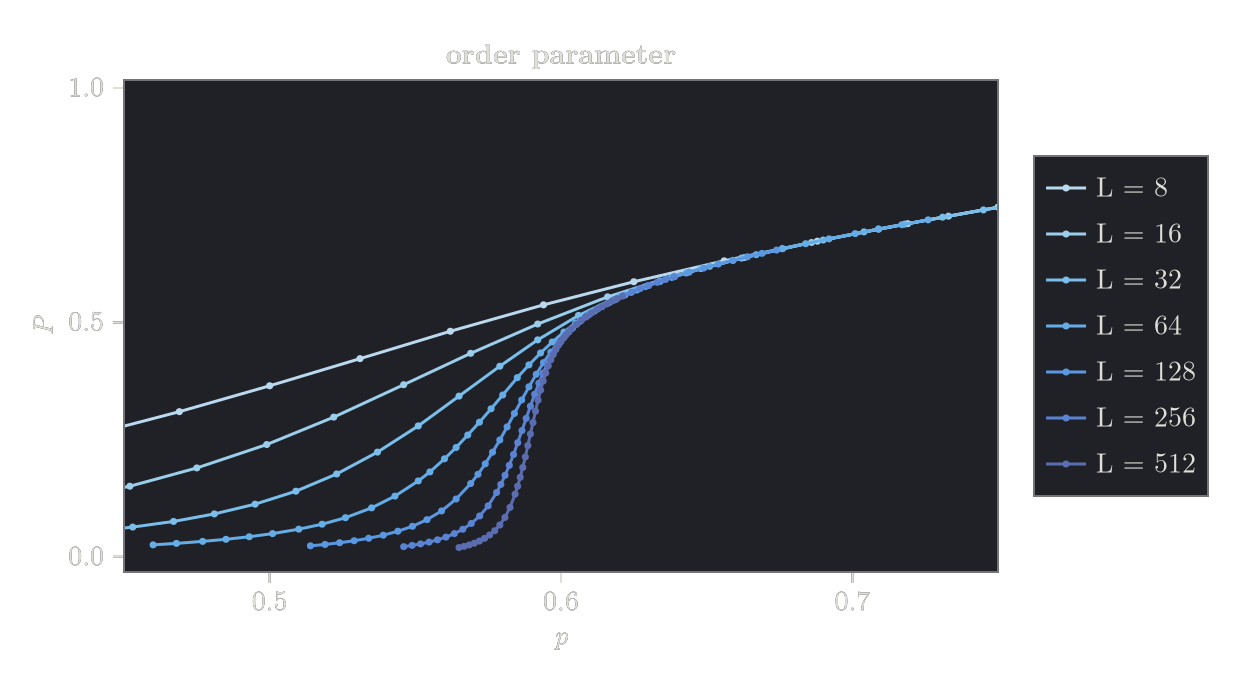
44The sizes are measured at different values of Pe are passed as the fourth argument.
using CairoMakie

colors = cgrad(:Blues)[range(0.3, 1.0; length=length(Ls))]
fig = Figure(size=(620, 340))
ax = Axis(fig[1, 1]; xlabel=L"p", ylabel=L"P", title="order parameter")
for i in eachindex(Ls)
    errorbars!(ax, ps[i], P[i], Pe[i]; color=colors[i])
    scatterlines!(ax, ps[i], P[i]; color=colors[i], markersize=5, label="L = $(Ls[i])")
end
xlims!(ax, 0.45, 0.75)
Legend(fig[1, 2], ax)
fig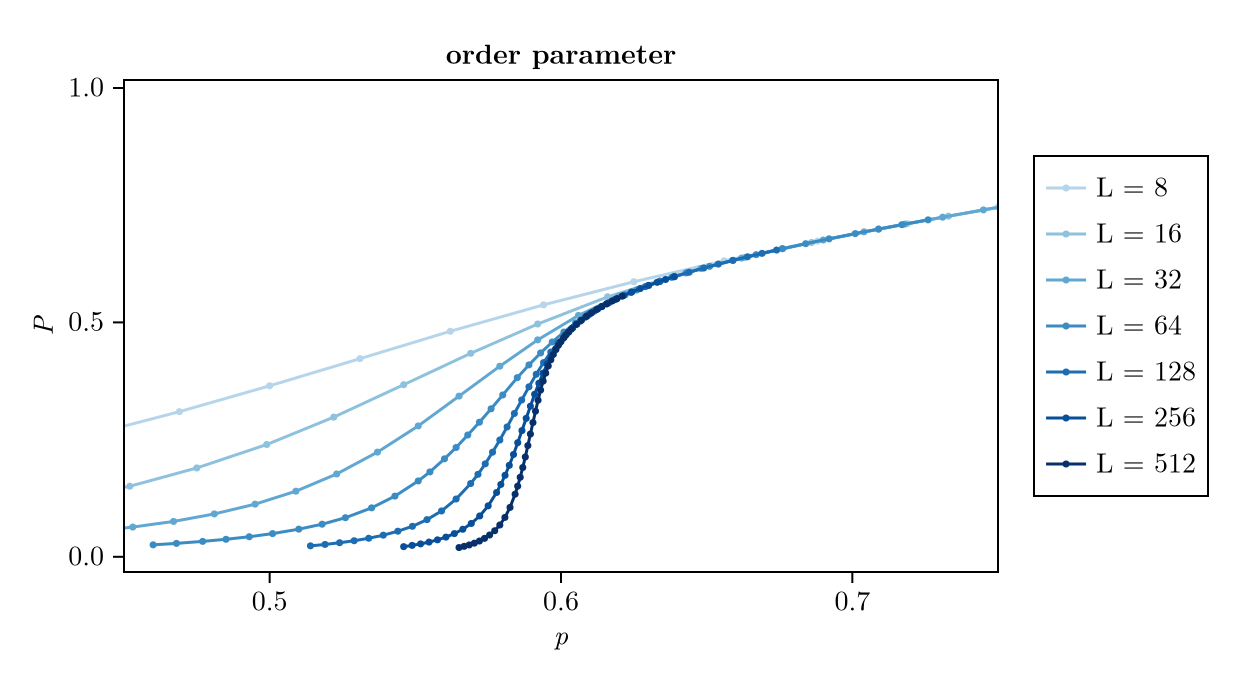
Fit with all sizes
The order parameter scales as :xy. We restrict the fit to the window
sf = ScalingFunction(:xy; p_names=["p_c", "nu", "beta"])
p_space = [0.58:0.002:0.61, 0.8:0.1:2.0, 0.05:0.025:0.3]
dx = [-1.5, 1.0]

sp_all = ScalingProblem(ps, P, Pe, Ls; sf, p_space, dx)
ScalingProblem
Scaling function:
x -> (x - p_c) * L^(1/nu)
y -> y * L^(beta/nu)
Optimal parameters:
p_c = 0.5916813894963331 ± 0.0006322587227533402
nu = 1.2985252861016483 ± 0.03633395866561683
beta = 0.15869698207951638 ± 0.00819883023280881
Optimization interval dx:
-1.5 < x < 1.0
Searched parameter space:
p_c ∈ 0.58:0.002:0.61
nu ∈ 0.8:0.1:2.0
beta ∈ 0.05:0.025:0.3The collapse looks convincing, yet
Corrections to scaling
The scaling form only holds for large
L_mins = Ls[1:5]
fits = [ScalingProblem(ps[k:end], P[k:end], Pe[k:end], Ls[k:end]; sf, p_space, dx)
        for k in eachindex(L_mins)]

exact = [0.5927460508, 4 / 3, 5 / 36]
labels = [L"p_c", L"\nu", L"\beta"]
fig = Figure(size=(780, 280))
for j in 1:3
    ax = Axis(fig[1, j]; xlabel=L"L_\mathrm{min}", ylabel=labels[j], xscale=log2,
        xticks=L_mins)
    hlines!(ax, [exact[j]]; color=:gray, linestyle=:dash)
    v = [f.optimal_ps[j] for f in fits]
    σ = [f.optimal_ps_error[j] for f in fits]
    errorbars!(ax, L_mins, v, σ; color=:black, whiskerwidth=6)
    scatter!(ax, L_mins, v; color=:black, markersize=8)
end
fig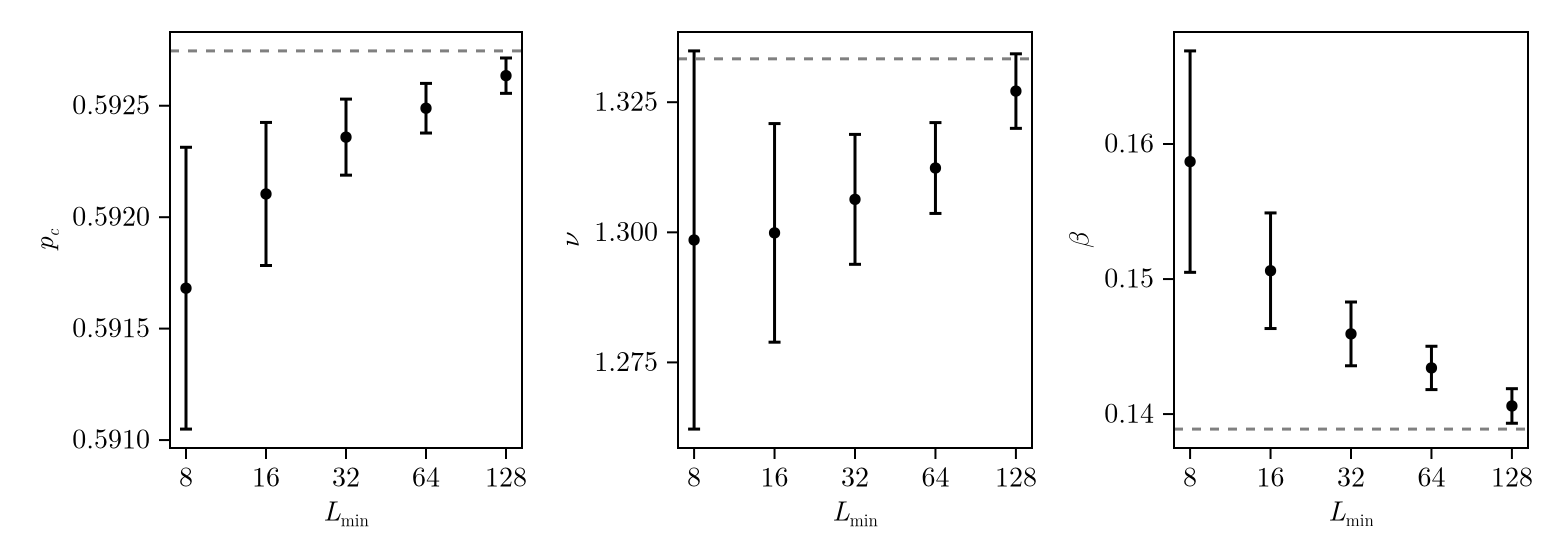
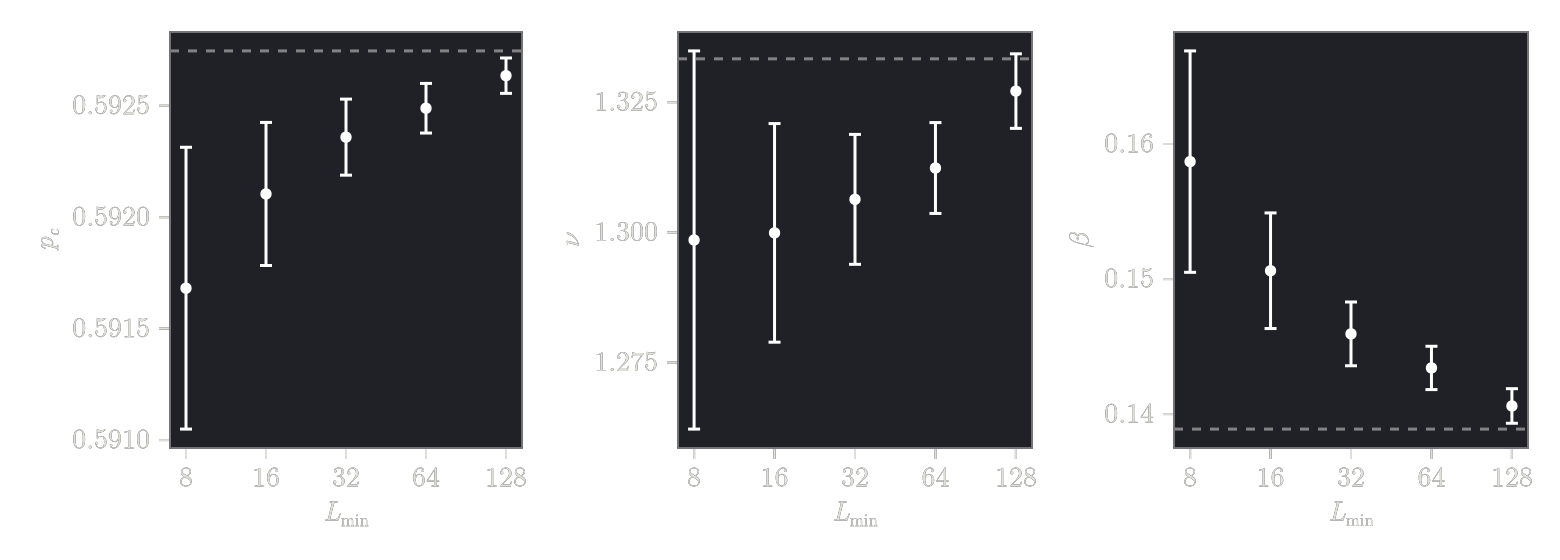
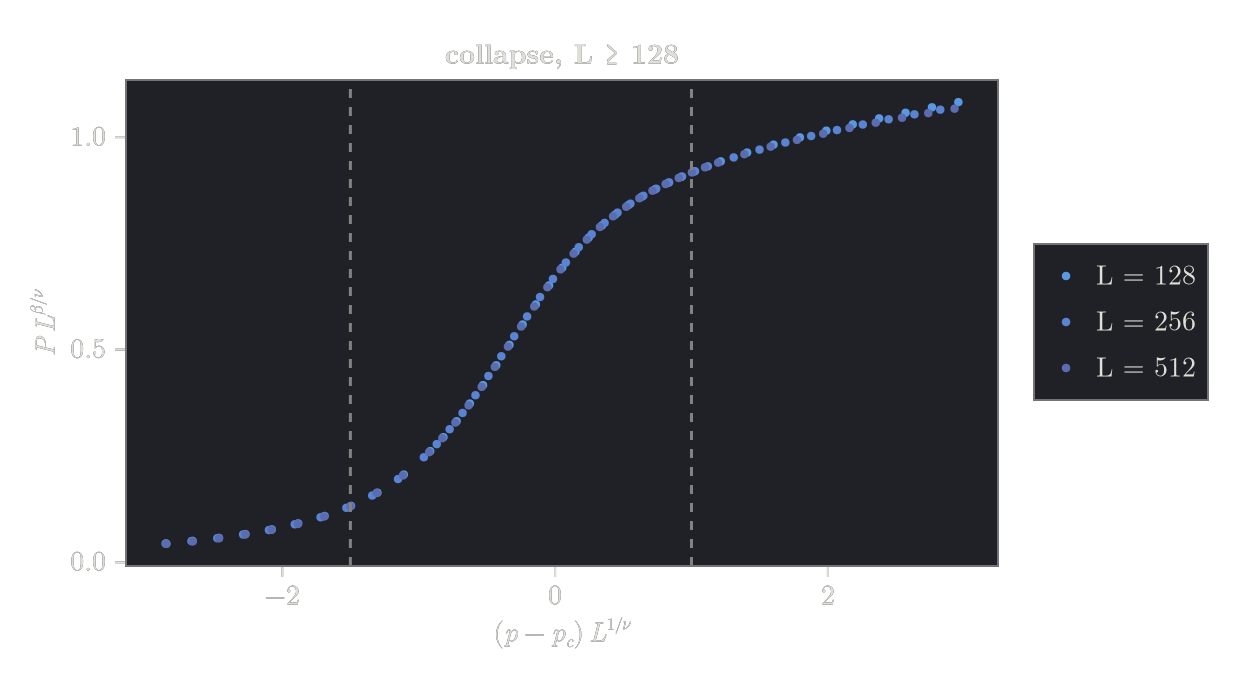
The estimates move steadily towards the exact values (dashed) as the smallest sizes are removed. With
sp = fits[end]ScalingProblem
Scaling function:
x -> (x - p_c) * L^(1/nu)
y -> y * L^(beta/nu)
Optimal parameters:
p_c = 0.5926349851950006 ± 7.933097685228381e-5
nu = 1.3271383611181755 ± 0.00716104851550221
beta = 0.14060129773112817 ± 0.0012798854058588985
Optimization interval dx:
-1.5 < x < 1.0
Searched parameter space:
p_c ∈ 0.58:0.002:0.61
nu ∈ 0.8:0.1:2.0
beta ∈ 0.05:0.025:0.3xs_s, ys_s, es_s, _ = scaled_data(sp)
fig = Figure(size=(620, 340))
ax = Axis(fig[1, 1]; xlabel=L"(p - p_c)\,L^{1/\nu}", ylabel=L"P\, L^{\beta/\nu}",
title="collapse, L ≥ 128")
for (i, L) in enumerate(Ls[5:end])
inside = -3 .<= xs_s[i] .<= 3
c = colors[4+i]
errorbars!(ax, xs_s[i][inside], ys_s[i][inside], es_s[i][inside]; color=c)
scatter!(ax, xs_s[i][inside], ys_s[i][inside]; color=c, markersize=6, label="L = $L")
end
vlines!(ax, dx; color=:gray, linestyle=:dash)
Legend(fig[1, 2], ax)
fig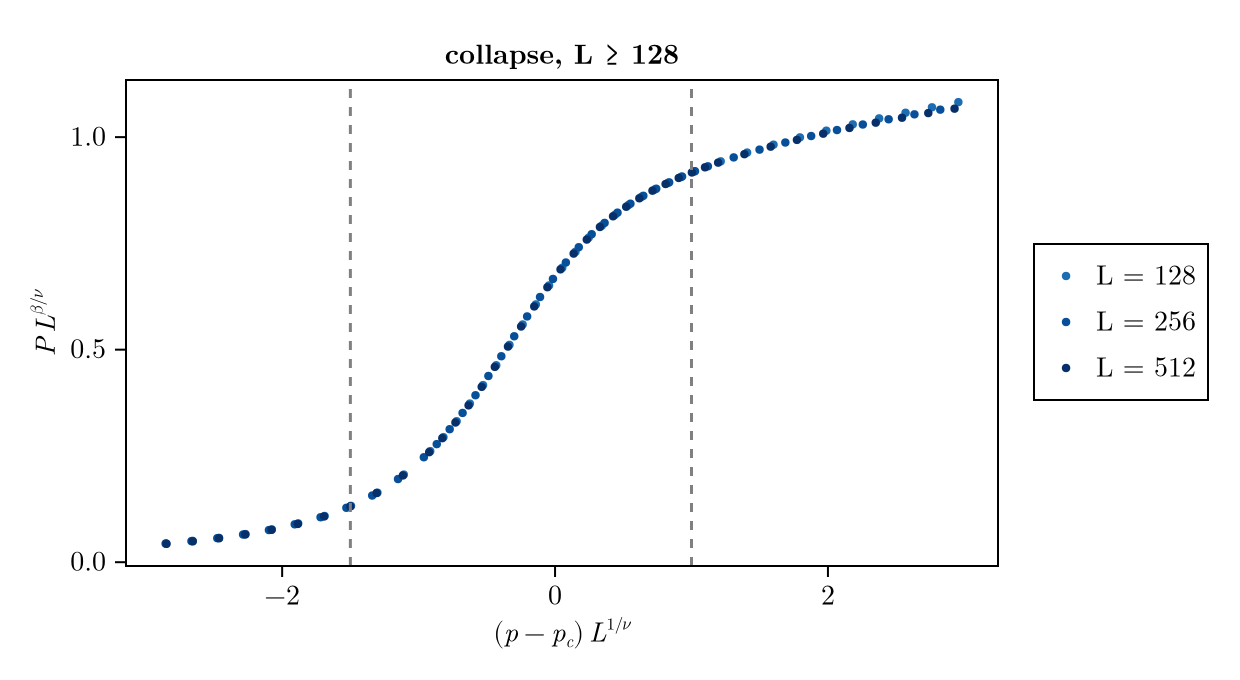
Profile and bootstrap errors
With error bars, error=:bootstrap gives the statistical errors of the parameters: the spread of fits to data sets resampled within the error bars.
using Random

for (name, s) in ("all sizes" => sp_all, "L ≥ 128" => sp)
    σ_boot = parameter_errors(s; method=:bootstrap, n_bootstrap=200, rng=Xoshiro(1))
    println(name)
    for j in 1:3
        p = ScalingCollapse.scaled_p_names(sf)[j]
        println("    ", rpad(p, 5), "deviation from exact ",
            rpad(round(s.optimal_ps[j] - exact[j]; sigdigits=2), 10),
            "profile ", rpad(round(s.optimal_ps_error[j]; sigdigits=2), 9),
            "bootstrap ", round(σ_boot[j]; sigdigits=2))
    end
end
all sizes
p_c deviation from exact -0.0011 profile 0.00063 bootstrap 1.7e-5
nu deviation from exact -0.035 profile 0.036 bootstrap 0.001
beta deviation from exact 0.02 profile 0.0082 bootstrap 0.00021
L ≥ 128
p_c deviation from exact -0.00011 profile 7.9e-5 bootstrap 3.0e-5
nu deviation from exact -0.0062 profile 0.0072 bootstrap 0.0031
beta deviation from exact 0.0017 profile 0.0013 bootstrap 0.00048The bootstrap errors are several times smaller than the profile widths, and for all sizes the deviations from the exact values exceed them by more than an order of magnitude: the bootstrap measures the noise of the data, not the systematic error of an incomplete scaling form. Quote bootstrap errors only after checking for corrections to scaling as above. The profile widths are not calibrated either, but they are a more conservative measure of how well the data constrain the parameters.