

Mean-field model: exact data
The Curie–Weiss model couples all nu of the presets is
For this model, the partition function is a sum over the
Exact finite-size data
using ScalingCollapse

# probabilities of the magnetization per spin m = M/N at temperature T
function distribution(N, T)
    logw = zeros(N + 1)            # log binomial(N, k), by recursion over k
    for k in 0:N-1
        logw[k+2] = logw[k+1] + log((N - k) / (k + 1))
    end
    Ms = [2k - N for k in 0:N]
    logw .+= Ms .^ 2 ./ (2N * T)   # Boltzmann weight exp(M²/(2NT))
    w = exp.(logw .- maximum(logw))
    return Ms ./ N, w ./ sum(w)
end

# Binder cumulant and susceptibility
function observables(N, T)
    m, w = distribution(N, T)
    m1, m2, m4 = sum(w .* abs.(m)), sum(w .* m .^ 2), sum(w .* m .^ 4)
    return 1 - m4 / (3m2^2), N * (m2 - m1^2) / T
end

Ns = [256, 1024, 4096, 16384]
Ts = collect(range(0.9, 1.1; length=41))
obs = [observables.(N, Ts) for N in Ns]
U = [first.(o) for o in obs]
chi = [last.(o) for o in obs]
Binder cumulant
For noise-free data, cubic splines interpolate more accurately than the default monotone interpolation, so we use MultipleSplines(interp=:cubic) (see Quality functions):
sp_U = ScalingProblem(Ts, U, Ns;
    sf=ScalingFunction(:x; p_names=["T_c", "nu"]),
    p_space=[0.9:0.01:1.1, 1.0:0.1:3.0],
    dx=[-2.0, 2.0],
    quality=MultipleSplines(interp=:cubic),
)
ScalingProblem
Scaling function:
x -> (x - T_c) * L^(1/nu)
y -> y
Optimal parameters:
T_c = 0.9989974399979069 ± 0.00041363100859527
nu = 1.9829418226820394 ± 0.05841166223464751
Optimization interval dx:
-2.0 < x < 2.0
Searched parameter space:
T_c ∈ 0.9:0.01:1.1
nu ∈ 1.0:0.1:3.0Susceptibility
The susceptibility :xny:
sp_chi = ScalingProblem(Ts, chi, Ns;
    sf=ScalingFunction(:xny; p_names=["T_c", "nu", "gamma"]),
    p_space=[0.9:0.01:1.1, 1.0:0.1:3.0, 0.5:0.1:1.5],
    dx=[-1.0, 1.0],
    quality=MultipleSplines(interp=:cubic),
)
ScalingProblem
Scaling function:
x -> (x - T_c) * L^(1/nu)
y -> y * L^(-gamma/nu)
Optimal parameters:
T_c = 0.9994342215950882 ± 0.0002032011285825485
nu = 2.0052423285269594 ± 0.01888288249567487
gamma = 1.0318872876514056 ± 0.012421623844931878
Optimization interval dx:
-1.0 < x < 1.0
Searched parameter space:
T_c ∈ 0.9:0.01:1.1
nu ∈ 1.0:0.1:3.0
gamma ∈ 0.5:0.1:1.5using CairoMakie
colors = cgrad(:Blues)[range(0.35, 1.0; length=length(Ns))]
fig = Figure(size=(780, 560))
for (row, sp, data, ylabel, ylabel_scaled) in (
(1, sp_U, U, L"U", L"U"),
(2, sp_chi, chi, L"\chi", L"\chi\, N^{-\gamma/\nu}"))
ax1 = Axis(fig[row, 1]; xlabel=L"T", ylabel)
ax2 = Axis(fig[row, 2]; xlabel=L"(T - T_c)\,N^{1/\nu}", ylabel=ylabel_scaled)
xs_s, ys_s, _, _ = scaled_data(sp)
for i in eachindex(Ns)
scatterlines!(ax1, Ts, data[i]; color=colors[i], markersize=5, label="N = $(Ns[i])")
inside = -4 .<= xs_s[i] .<= 4
scatter!(ax2, xs_s[i][inside], ys_s[i][inside]; color=colors[i], markersize=7)
end
vlines!(ax2, sp.dx; color=:gray, linestyle=:dash)
row == 1 && Legend(fig[1:2, 3], ax1)
end
fig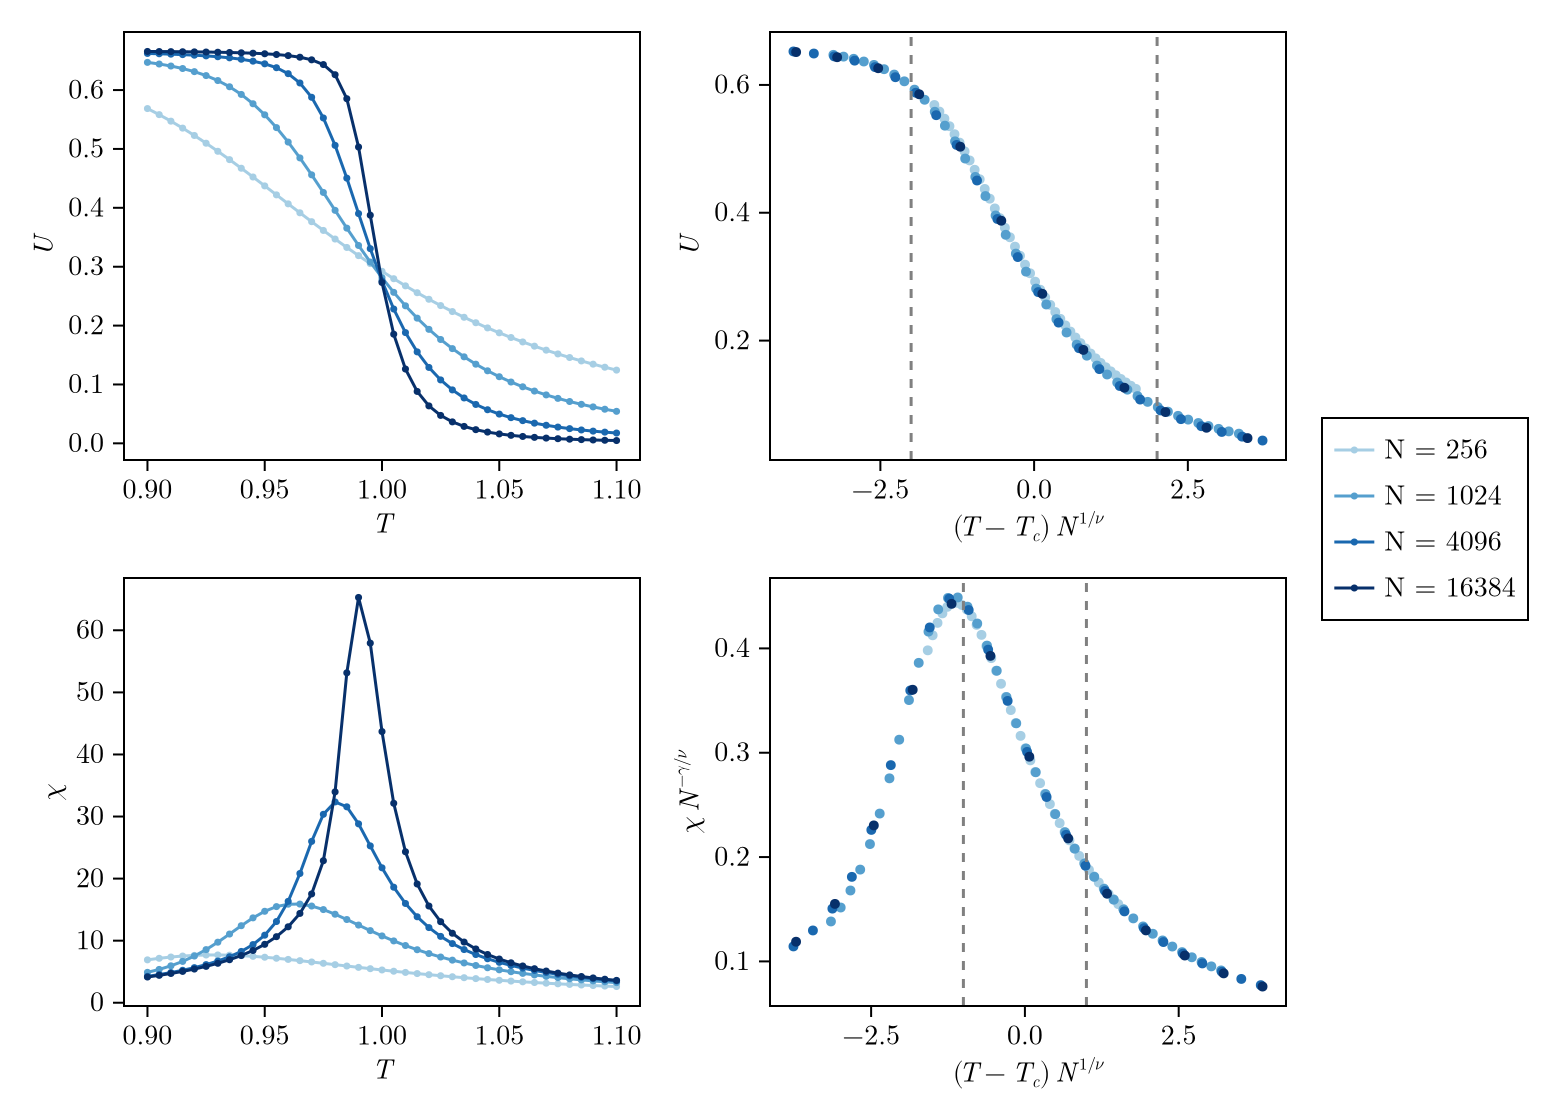
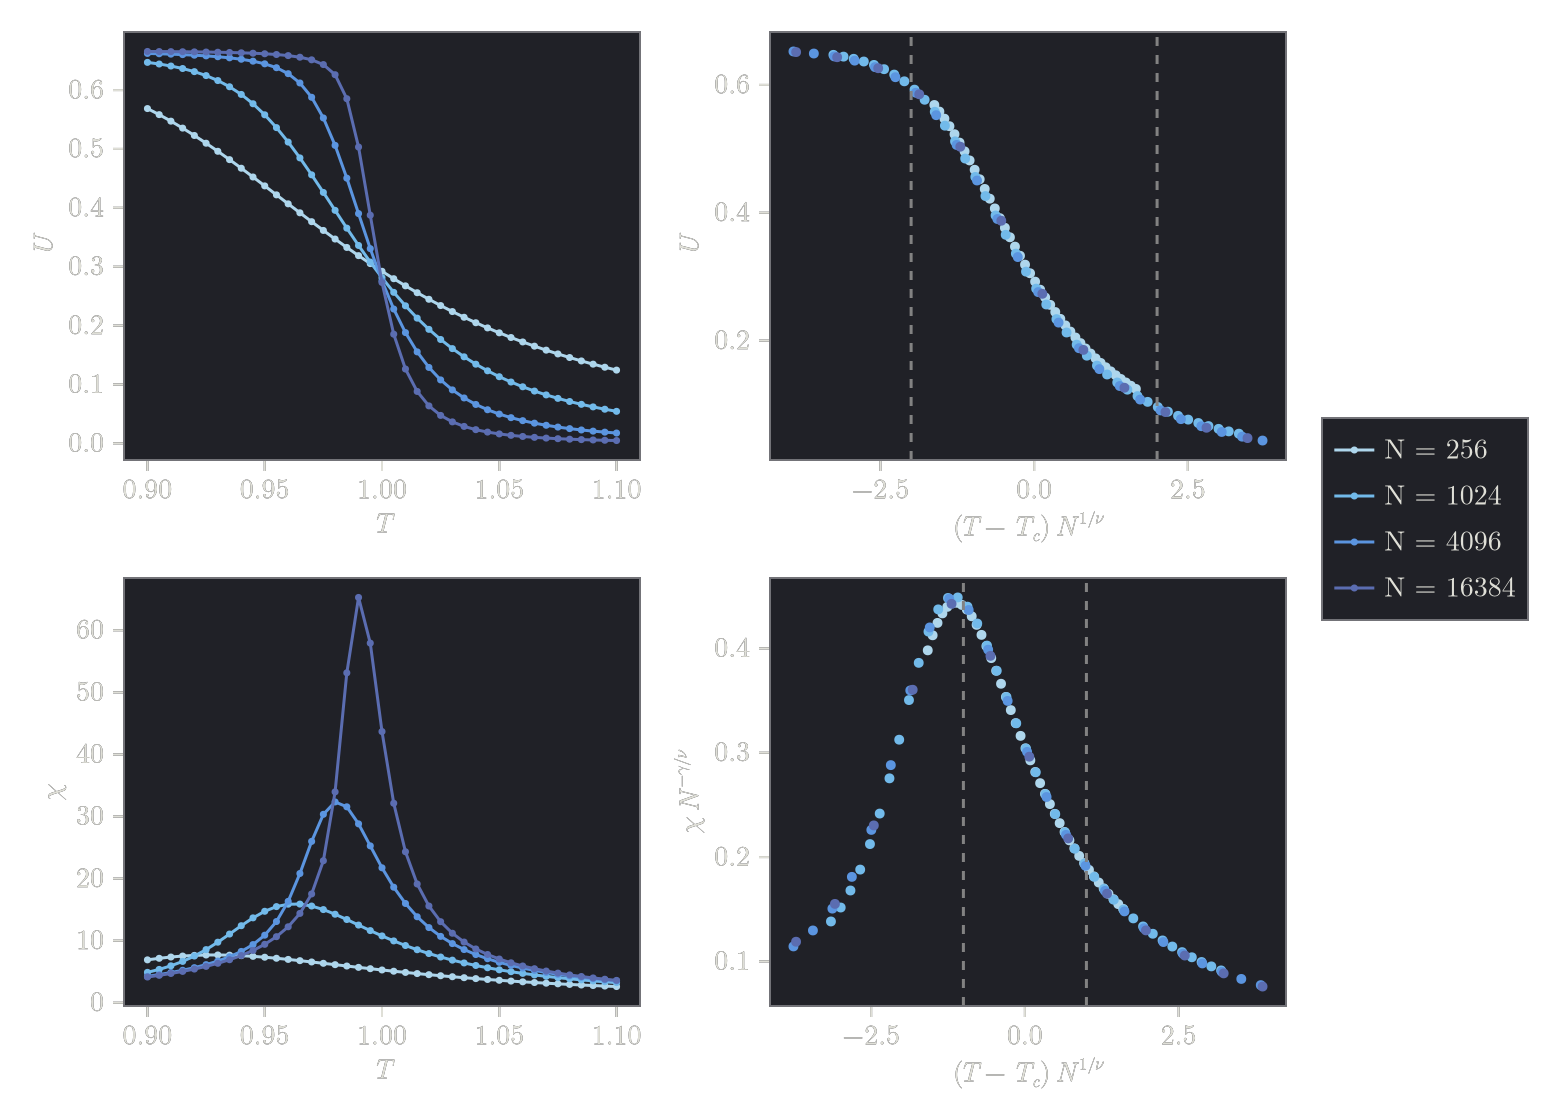
Exact data are not free of errors
Both fits agree with