

Getting Started
This tutorial performs a complete finite-size scaling analysis of synthetic data whose critical parameters we know, so that we can check the result. The examples apply the same steps to real data.
The data
Suppose we measured an order parameter
with
using ScalingCollapse
using Random

x_c, ν, β = 0.5, 1.2, 0.3
F(z) = 1 / (1 + exp(2z)) + 0.2       # the master curve

rng = Xoshiro(42)
Ls = [16, 32, 64, 128]
xs = collect(range(0.3, 0.7; length=41))
ys = Vector{Float64}[]
es = Vector{Float64}[]
for L in Ls
    y = L^(-β / ν) .* F.((xs .- x_c) .* L^(1 / ν))
    e = 0.01 .* y                    # error bars
    push!(ys, y .+ e .* randn(rng, length(y)))
    push!(es, e)
end
All sizes share the x values xs, so a single vector is enough; ys and es hold one vector per system size. Input data lists all accepted formats, including matrices and Measurements.
Solving the scaling problem
A ScalingProblem needs the data, a ScalingFunction that describes the scaling form, and a range for each parameter to search:
sp = ScalingProblem(xs, ys, es, Ls;
    sf=ScalingFunction(:xy; p_names=["x_c", "nu", "beta"]),
    p_space=[0.4:0.01:0.6, 0.5:0.1:2.0, 0.0:0.05:0.6],
    dx=[-3.0, 3.0],
)
ScalingProblem
Scaling function:
x -> (x - x_c) * L^(1/nu)
y -> y * L^(beta/nu)
Optimal parameters:
x_c = 0.4993633106128095 ± 0.0010700319582023143
nu = 1.199966497848909 ± 0.026560857304822175
beta = 0.2966346416241594 ± 0.012373184632310142
Optimization interval dx:
-3.0 < x < 3.0
Searched parameter space:
x_c ∈ 0.4:0.01:0.6
nu ∈ 0.5:0.1:2.0
beta ∈ 0.0:0.05:0.6The constructor did all the work:
The preset
:xyrescales the data asp_namesgives the three parameters their names.It evaluated the quality of the collapse on every point of the grid
p_spaceand refined the best candidates with the Nelder–Mead method.It estimated the error of every parameter (by default from the profile of the quality function, see Error analysis).
dx restricts the comparison of the curves to rescaled x values between -3 and 3, i.e. to the critical region, where the scaling form holds best. All three parameters agree with the values we put in. The results are fields of sp:
sp.optimal_ps3-element Vector{Float64}:
0.4993633106128095
1.199966497848909
0.2966346416241594sp.optimal_ps_error3-element Vector{Float64}:
0.0010700319582023143
0.026560857304822175
0.012373184632310142sp.minimum # the quality of the collapse at the optimum (lower is better)0.5051654376586426Plotting the collapse
scaled_data returns the rescaled data, one vector per system size. Plotted next to the raw data, the collapse looks like this (the dashed lines mark the window dx):
using CairoMakie

xs_scaled, ys_scaled, es_scaled, _ = scaled_data(sp)

colors = cgrad(:Blues)[range(0.35, 1.0; length=length(Ls))]
fig = Figure(size=(760, 320))
ax1 = Axis(fig[1, 1]; xlabel=L"x", ylabel=L"Y", title="data")
ax2 = Axis(fig[1, 2]; xlabel=L"(x - x_c)\,L^{1/\nu}", ylabel=L"Y\,L^{\beta/\nu}",
    title="collapse")
for i in eachindex(Ls)
    errorbars!(ax1, xs, ys[i], es[i]; color=colors[i])
    scatter!(ax1, xs, ys[i]; color=colors[i], markersize=6, label="L = $(Ls[i])")
    errorbars!(ax2, xs_scaled[i], ys_scaled[i], es_scaled[i]; color=colors[i])
    scatter!(ax2, xs_scaled[i], ys_scaled[i]; color=colors[i], markersize=6)
end
vlines!(ax2, sp.dx; color=:gray, linestyle=:dash)
xlims!(ax2, -8, 8)
Legend(fig[1, 3], ax1)
fig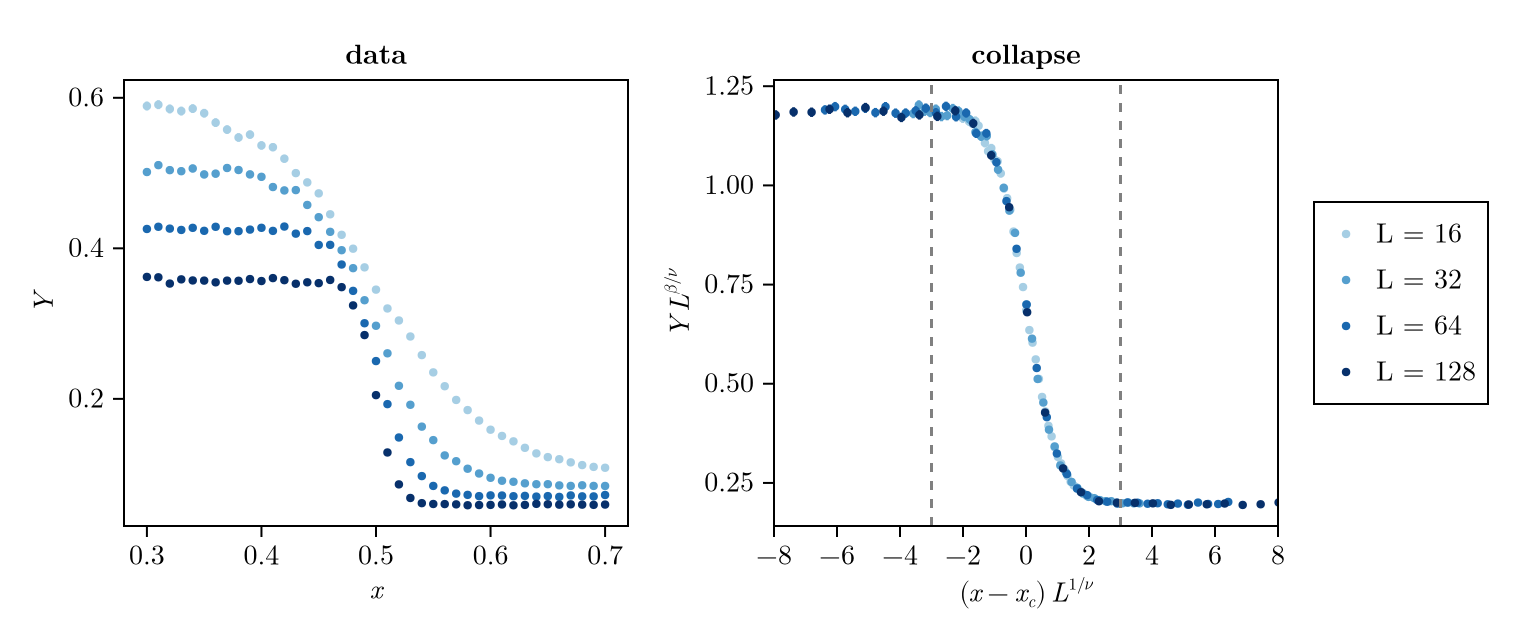
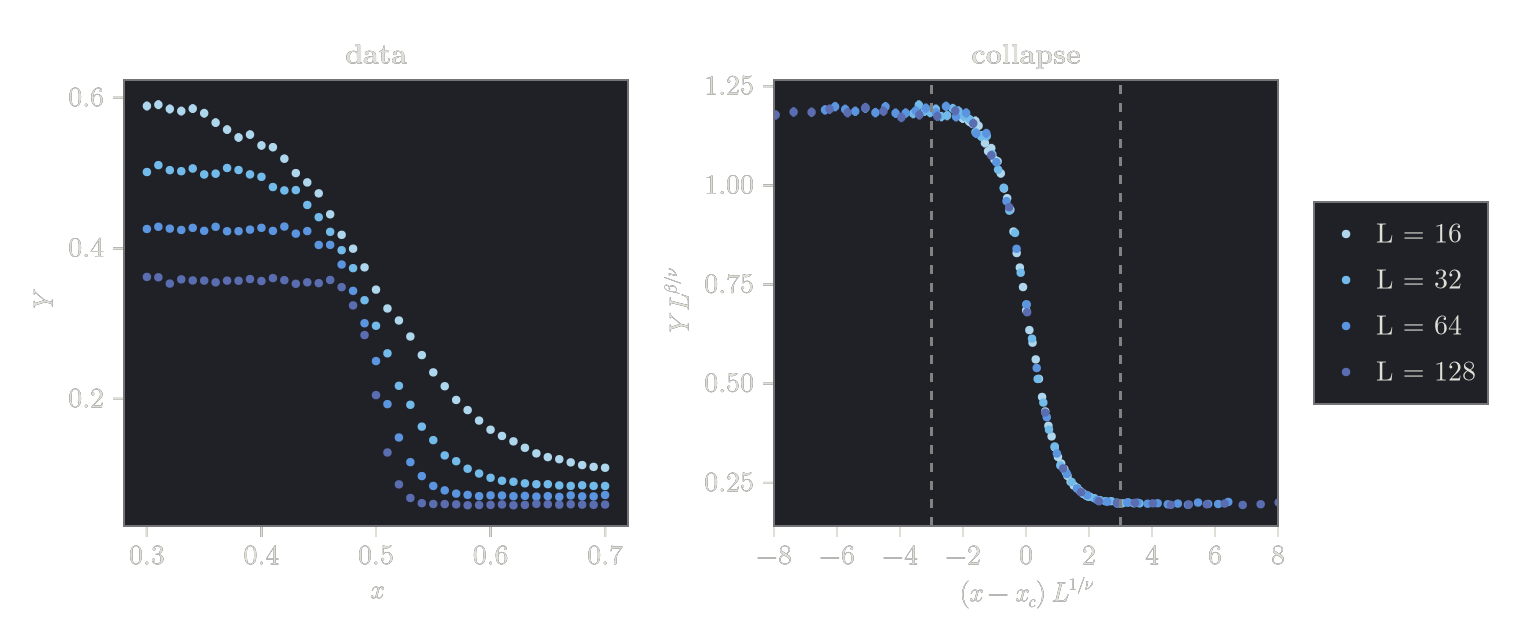
Figure style
The figures in this documentation use LaTeX fonts and no grid lines. To get the same style, run set_theme!(theme_latexfonts(); Axis=(xgridvisible=false, ygridvisible=false)) once before plotting.
Fixing a parameter
If a parameter is known, e.g. from theory, fix it by passing its name and value to the ScalingFunction. It is then no longer fitted, and p_space, optimal_ps and optimal_ps_error only refer to the remaining free parameters:
sp_fixed = ScalingProblem(xs, ys, es, Ls;
    sf=ScalingFunction(:xy; p_names=["x_c", "nu", "beta"], nu=1.2),
    p_space=[0.4:0.01:0.6, 0.0:0.05:0.6],
    dx=[-3.0, 3.0],
)
ScalingProblem
Scaling function:
x -> (x - x_c) * L^(1/nu)
y -> y * L^(beta/nu)
Fixed parameters:
nu = 1.2
Optimal parameters:
x_c = 0.49936275917764916 ± 0.0009338774869884483
beta = 0.29664095379804645 ± 0.011326437393130226
Optimization interval dx:
-3.0 < x < 3.0
Searched parameter space:
x_c ∈ 0.4:0.01:0.6
beta ∈ 0.0:0.05:0.6Next steps
Finite-size scaling explains which preset fits which observable.
Fitting covers the search (
p_space,starting_ps,dx) and what to do when a fit fails.Error analysis compares the error methods and shows how to inspect the quality landscape.
The examples start with the 2D Ising model.