

Uniform grids and quality landscapes
A fit is only as good as the quality function it minimizes. This example uses residuals to look at the quality landscape of all quality functions, and shows why the default MultipleSplines is smooth where the others are not.
The data
We use the spanning probability of bond percolation on the square lattice (test/testdata/percolation of the repository. The probabilities
using ScalingCollapse
using HDF5

file = joinpath(pkgdir(ScalingCollapse), "test", "testdata", "percolation", "bond_square.h5")
Ls, xs, ys, es = h5open(file) do h
    Ls = read(h, "Ls")
    curves(v) = [read(h, "spanning/L$L/$v") for L in Ls]  # one vector per size
    Ls, curves("x"), curves("y"), curves("e")
end
Fits with every quality function
sf = ScalingFunction(:x; p_names=["p_c", "nu"])
setup = (; sf, p_space=[0.48:0.002:0.52, 0.8:0.1:2.0], dx=[-0.5, 0.5])
qualities = ["MultipleSplines" => MultipleSplines(), "Linear" => Linear(),
    "SingleSpline" => SingleSpline(), "Houdayer" => Houdayer()]
fits = [name => ScalingProblem(xs, ys, es, Ls; setup..., quality) for (name, quality) in qualities]
for (name, sp) in fits
    println(rpad(name, 16), "p_c = ", round(sp.optimal_ps[1]; digits=5), " ± ",
        round(sp.optimal_ps_error[1]; digits=5), ",  nu = ", round(sp.optimal_ps[2]; digits=3),
        " ± ", round(sp.optimal_ps_error[2]; digits=3))
end
MultipleSplines p_c = 0.50074 ± 0.00036, nu = 1.319 ± 0.045
Linear p_c = 0.50069 ± 0.00036, nu = 1.318 ± 0.043
SingleSpline p_c = 0.50079 ± 0.00038, nu = 1.319 ± 0.048
Houdayer p_c = 0.50097 ± 0.00042, nu = 1.313 ± 0.046All four fits agree with each other, and with the exact values to within about two errors. Their landscapes do not.
The landscapes
residuals evaluates the quality function of a problem on a parameter grid. We plot
using CairoMakie

grid = [0.497:0.0001:0.503, 1.0:0.005:1.7]
fig = Figure(size=(780, 620))
for (k, (name, sp)) in enumerate(fits)
    ps, S = residuals(sp; p_space=grid)
    ax = Axis(fig[fldmod1(k, 2)...]; title=name, xlabel=L"p_c", ylabel=L"\nu")
    heatmap!(ax, ps[1], ps[2], log10.(S ./ minimum(S));
        colormap=Reverse(:Blues), colorrange=(0, 1.5))
    scatter!(ax, [0.5], [4 / 3]; color=:white, strokecolor=:black, strokewidth=1.5,
        markersize=10)
end
Colorbar(fig[1:2, 3]; colormap=Reverse(:Blues), colorrange=(0, 1.5),
    label=L"\log_{10}(S / S_\mathrm{min})")
fig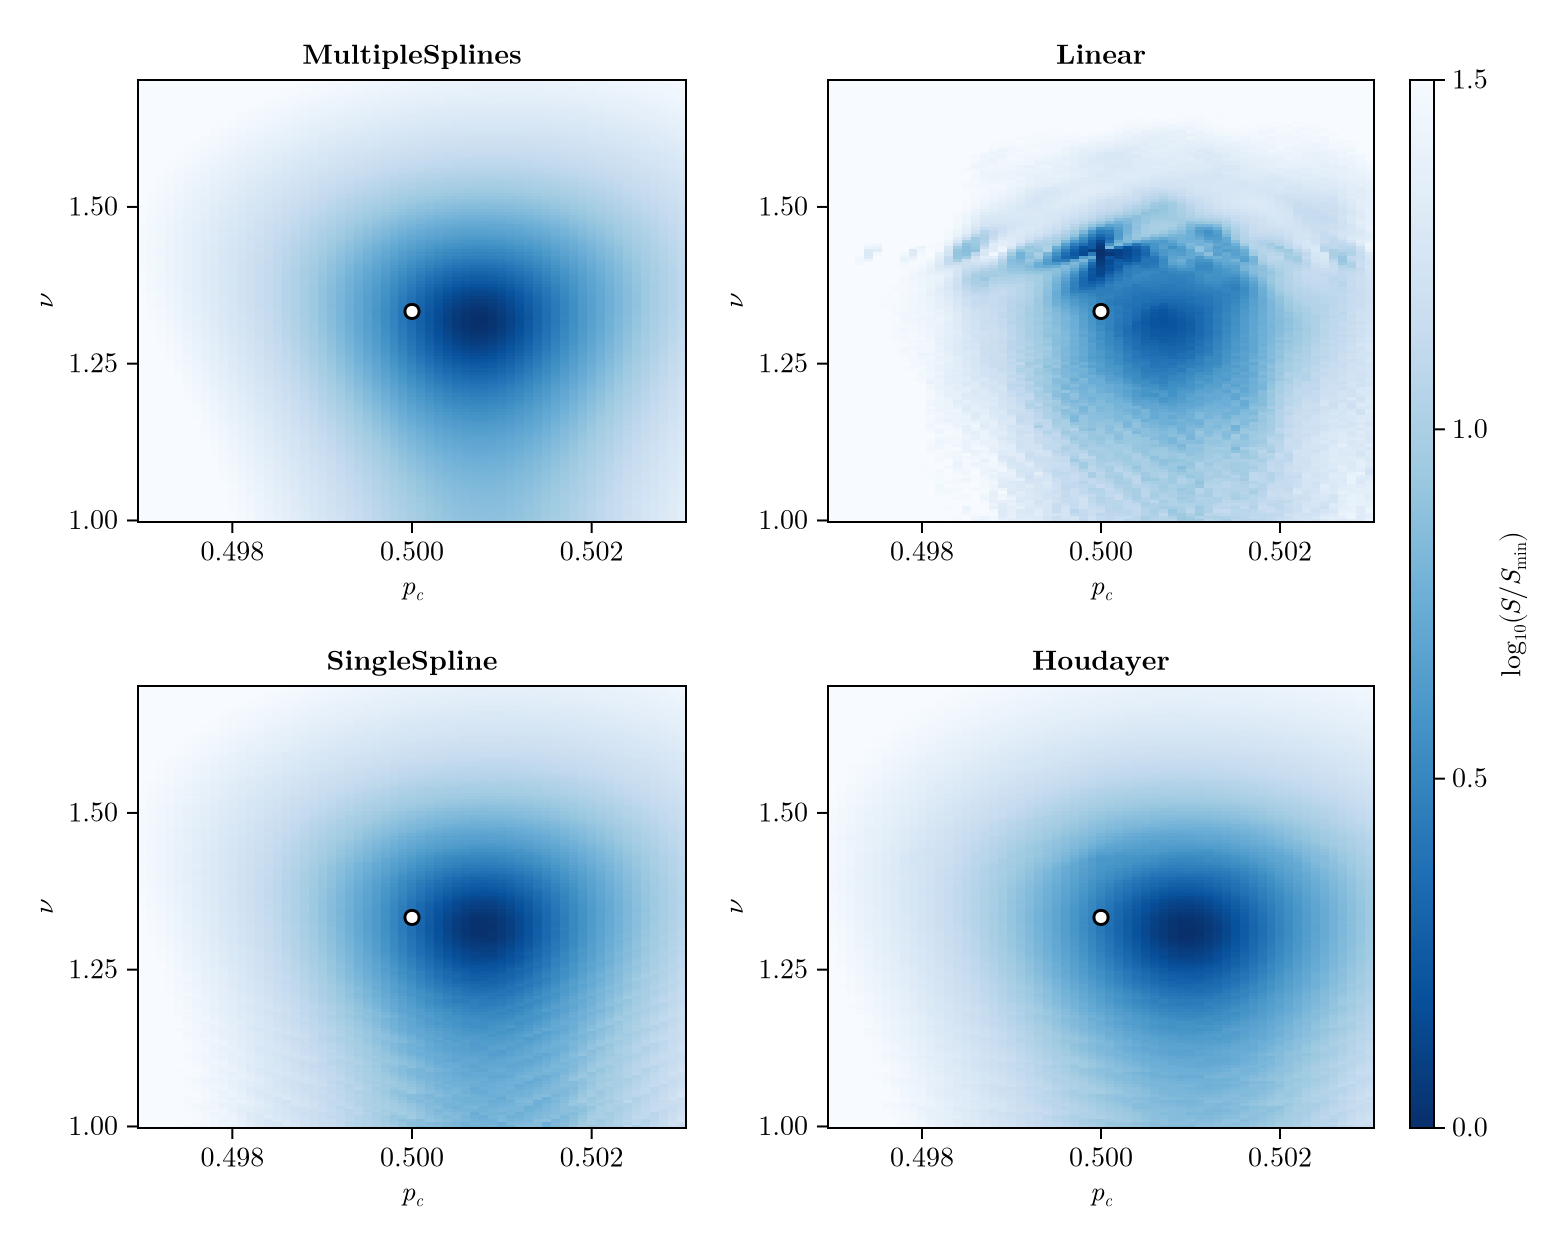
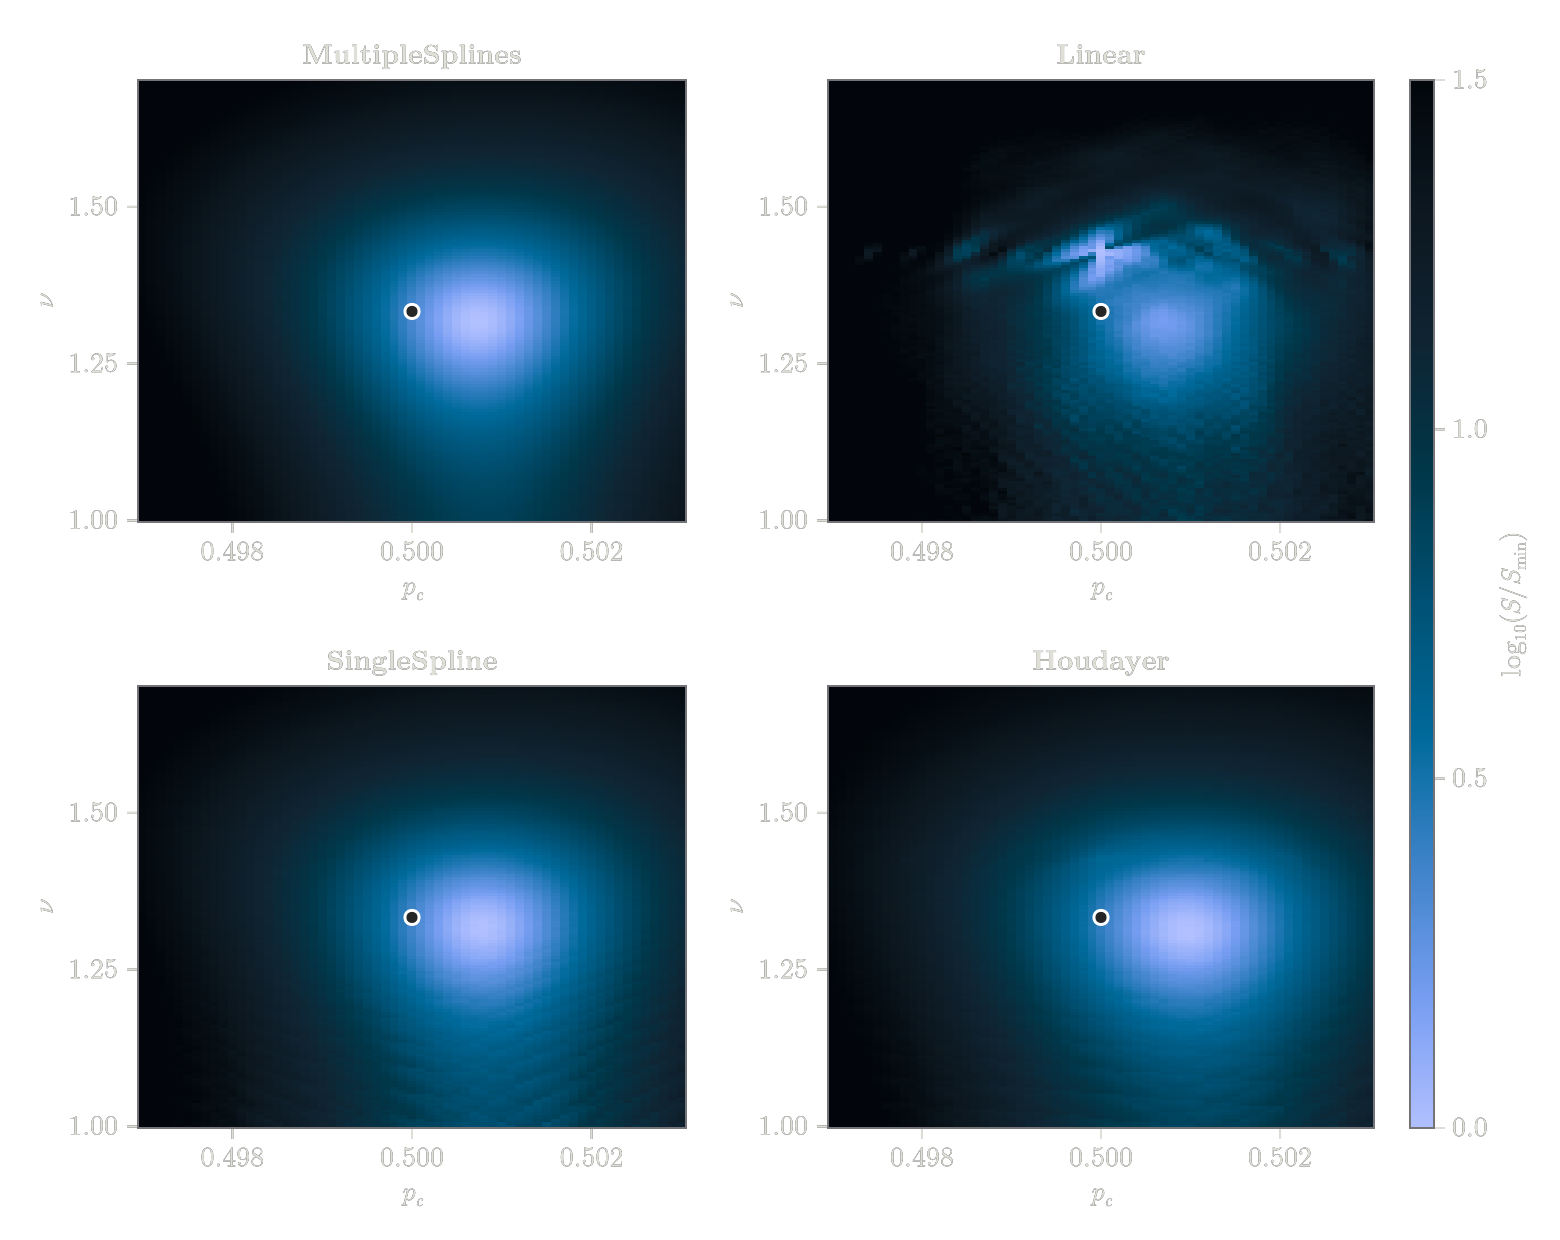
The white dot marks the exact values. MultipleSplines has a single smooth valley close to them. SingleSpline and Houdayer are rippled, and Linear has a sharp cross-shaped structure at
A cut along
fig = Figure(size=(780, 360))
ax = Axis(fig[1, 1]; xlabel=L"\nu", ylabel=L"S / S_\mathrm{min}", yscale=log10,
    yticks=[1, 2, 5, 10, 20, 50], title=L"quality at $p_c = 1/2$")
for (name, sp) in fits
    ps, S = residuals(sp; dims=[1, 2], p_space=[0.5:0.5, 1.0:0.002:1.8])
    lines!(ax, ps[2], S[1, :] ./ minimum(S); linewidth=2, label=name)
end
vlines!(ax, [4 / 3, 1 / 0.7]; color=:gray, linestyle=:dash)
Legend(fig[1, 2], ax)
fig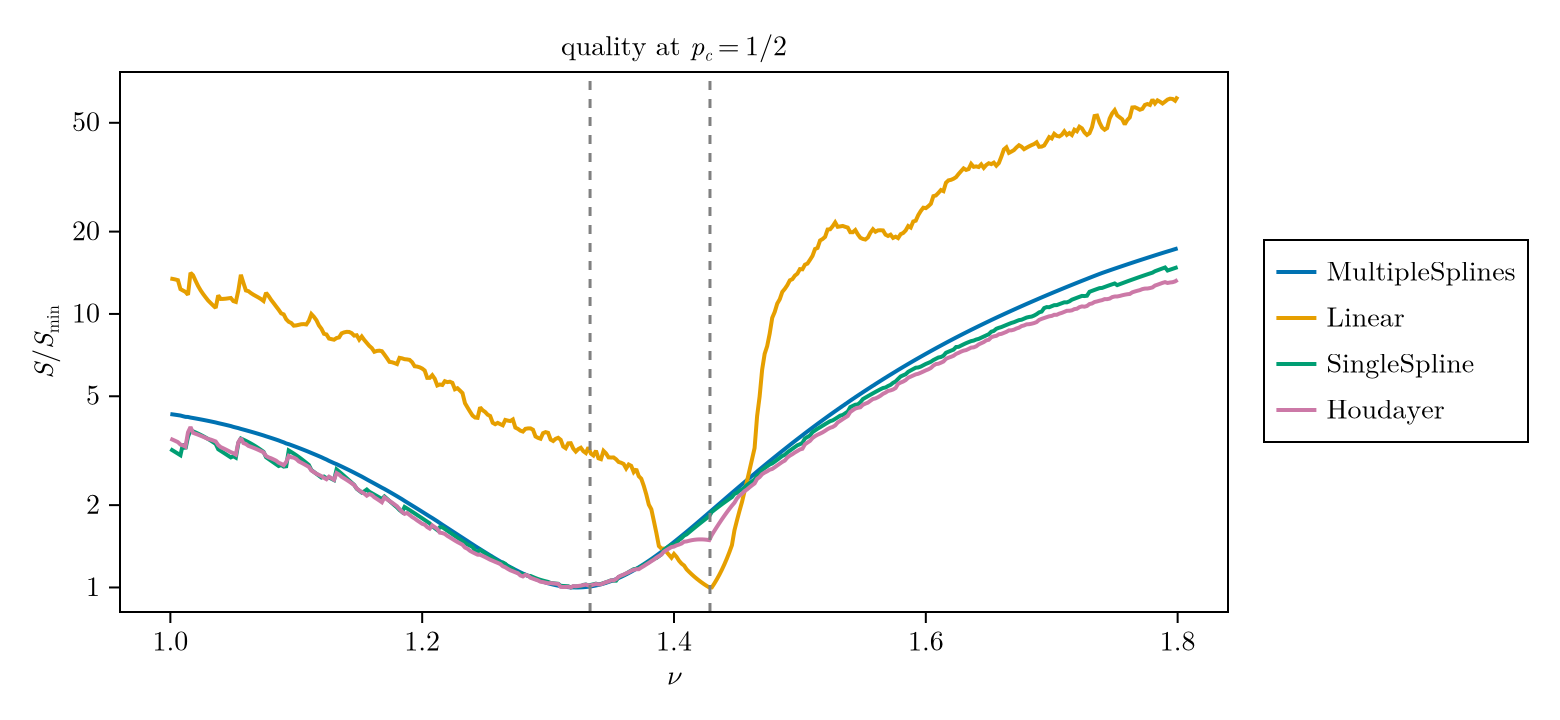
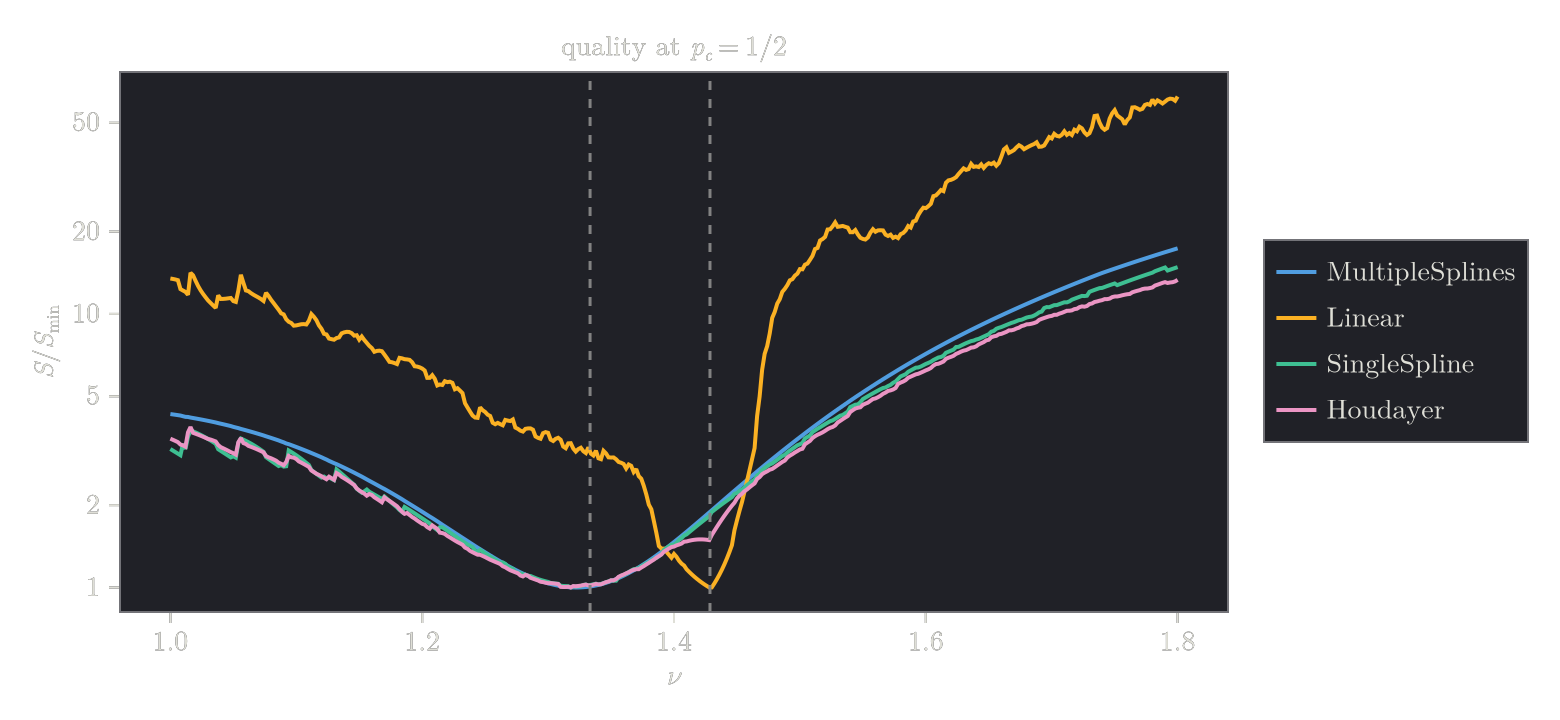
The dashed lines mark Linear then compares points of different sizes at the same x, without any interpolation error, and its quality drops to a false minimum, lower than the one near the true Linear, SingleSpline, Houdayer) also jump whenever points of different sizes pass each other, which produces the ripples.
MultipleSplines compares smooth interpolations of every size on a fixed set of points, so it does not care how the grids of the sizes line up. Its landscape is smooth, which makes both the fit and the error analysis reliable.
Tip
Whatever the quality function, plotting the landscape around a fit with residuals is a quick check that the minimum is real and not an artifact of the data grid.